You might have "stealth" high demand SIFs in your plant. How do you know, and what is the potential impact? Read on to find out how you can stop these stealth operatives before they attack!
Background
The international functional safety standard IEC 61511 specifies three possible operating modes for safety instrumented functions (SIFs):
- Low Demand Mode
- High Demand Mode
- Continuous Mode
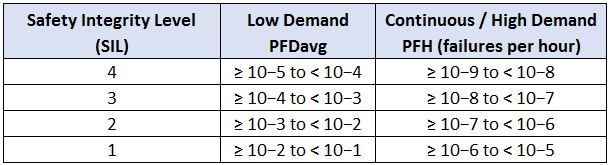
This post is going to concentrate on the first two modes, Low and High demand mode. Although both modes use the familiar Safety Integrity Level (SIL) terminology, the underlying definitions of SIL use a different metric for each mode. Low demand mode uses the familiar Average Probability of Failure on Demand (PFDavg), while High demand mode uses the less common Probability of Failure per Hour (PFH). As a quick refresher, here are the performance limits from the standard:
Conventional wisdom is that nearly all SIFs in chemical plants and refineries operate in low demand mode. Most conventional risk assessment / SIL assignment methods (such as LOPA) inherently assume that SIFs are low demand. But how do we know if a SIF is operating in low demand mode or high demand mode?
Demanding Definitions
IEC 61511 defines high demand mode as SIF where:
[...] is only performed on demand, in order to transfer the process into a specified safe state, and where the frequency of demands is greater than one year
The definition for low demand mode is identical, except that the demand rate is no greater than once per year.
Those definitions seem pretty straightforward...until you delve into the ISA84 Technical Reports. In TR84.00.04 Part 1 Annex I, you will find this little nugget:
Second, if the mean time to demand is less than twice the test interval, the SIF should be considered high demand mode (e.g. if the mean time to demand is 10 years, a proof test interval longer than 5 years would be high demand mode).
Let's consider an example for a moment. Suppose we have four LOPA scenarios caused by four different initiating event failures, each with a frequency of 0.1 /yr. The same SIF is the only IPL for all three scenarios. Summing up the scenarios, the predicted demand rate on the SIF is 0.1 + 0.1 + 0.1 + 0.1 = 0.4 /yr, or a mean demand interval of 2.5 years. Safely in the Low Demand range, right? Not so fast!
Hypothetically, the low demand SIL calculations calculated PFDavg and initially assumed a proof test interval (PTI) of every two years. However, per the guidance above, the proof test interval should be no more than 2.5 yr / 2 = 1.25 years to be considered low demand. The SIS engineer is faced with the choice of either significantly reducing the proof test interval or redesigning the SIF for high demand mode.
What is the Practical Impact?
Misclassifying high demand SIFs as low demand has several potential impacts, some more significant than others. The actual impact depends on several factor, so we just summarize potential impacts:
- For many typical SIF designs, erroneously using PFDavg may actually understate the achieved risk reduction (i.e. be overly conservative) versus the PFH calculation for high demand.
- Conversely, some systems that rely on proof testing with very high proof test coverage may overstate the achieved risk reduction
- Using low demand assumptions in the risk assessment may cause the required risk reduction (i.e. SIL) to be overstated (see the SIS-Tech paper below for good examples of this)
It's difficult to give simple guidance on the above items because design approaches for low demand and high demand are just fundamentally different. It may be somewhat misleading to say that on one hand a SIL3 low demand SIF is required, but on the other hand "only" a SIL1 high demand SIF is required. Since the high demand SIF cannot credit intermittent proof testing, a higher level of hardware fault tolerance or diagnostics may be required. A SIL1 high demand SIF may look and smell a bit like a higher SIL low demand SIF.
Further Reading
This is a technical topic that is hard to do justice in a short(ish) blog post. Lucky for you, others have written excellent full length papers on this topic.
For an overview of the topic and a very clear explanation of the "twice the demand rate" rule, please check out this whitepaper from Geoffrey Barnard at aeSolutions.
For another good discussion of the topic featuring examples of incorrect and correct LOPA applications, please check out this conference paper from the folks at SIS-Tech.
You will also find this topic discussed in several books conveniently located in the store.
Thanks, Steven. Just a question on this: If I have a scenario where the demand rate is 15 times per year. The SIF is tested every single week i.e., 52 times per year. Is this still high demand mode?