Some time ago, I ran across a complex Safety Instrumented Function (SIF) that had a proof test interval (PTI) of 187 days. Upon seeing that, I thought “Hmm, that’s odd…Oooh wait, I know what’s going on…”. Upon investigating the SIL calculations for this SIF, I found that a proof test interval of 188-days didn’t quite make the SIL target, but the 187-day interval squeaked by. Victory! Not exactly. Doing your SIL calculations to 5 decimal places doesn’t make it so.
In today’s post, we will talk about handling uncertainty in the functional safety lifecycle. We will try to answer the questions “How uncertain is typical failure rate data?” and “How do we deal with that uncertainty in our SIL calculations?”. This post will present one practical method for doing these types of assessments.
Standard Requirements
The failure rate of a SIF or any of its component devices is not a precisely measurable value. The value must be predicted or estimated based on a variety of potential sources of information, with each source of information having its own uncertainties.
The 2nd edition of IEC 61511 adds a new requirement related to failure rate data used for SIS:
“The reliability data uncertainties shall be assessed and taken into account when calculating the failure measure.”
The standard does not specify how this assessment must be done, but suggests possible approaches including conventional confidence intervals, Bayesian Approaches, engineering judgement, Monte Carlo simulation, etc. In this post, we will demonstrate a subjective Bayesian approach combined with Monte Carlo simulation.
Component Failure Rate Uncertainty
To give a simple example of uncertainty assessment, we will use a subjective Bayesian method based on multiple publicly available data sources and engineering judgement. I say “subjective” because there are mathematically rigorous ways to combine data from multiple sources, but we are just going to use some simple metrics: Min, Max, and Average.
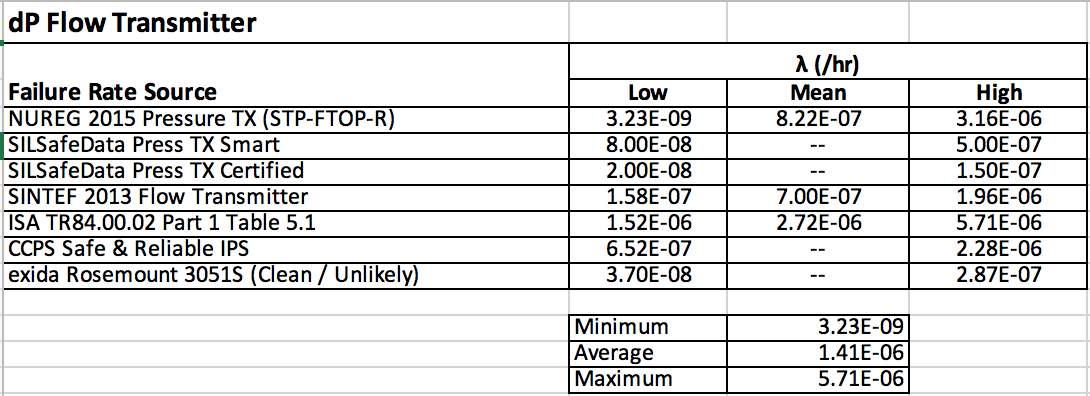
The data for a generic dP flow transmitter is shown in the table below. This data represents a broad sample of industry data and does not assume we know anything about the particular device or particular service. You will notice that the ratio of the highest to lowest failure rates is almost three orders of magnitude. Keep that in mind the next time sometime casually mentions “order of magnitude” SIL calculations!
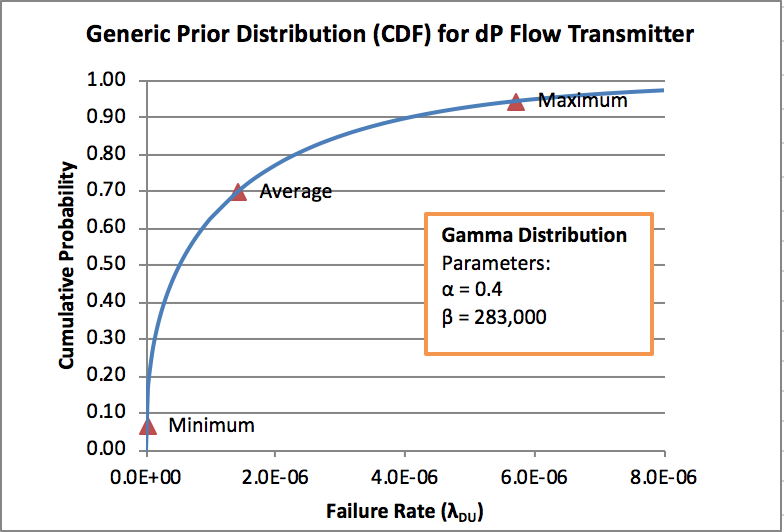
Since we want to use Monte Carlo simulation for the uncertainty analysis of the overall SIF, the next step is to fit a distribution to the data. This process is discussed in more detail in my Bayesian papers, so I won’t go into it here. Suffice it to say that we are using a Gamma distribution and a/b is the mean, while b sets the width of the distribution. The end result is shown below with the Min, Max, and Average above marked:
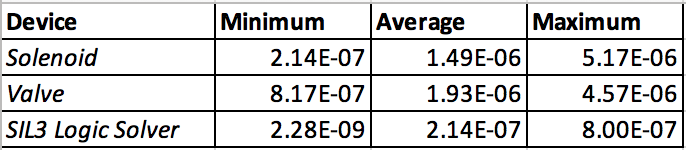
This same process can be done for valves, solenoids, logic solvers, etc. and is covered in my Bayesian papers. Those papers also go into how these generic failure rates can be updated with end-user data, but we will skip that for now. For info, here is an example range of industry data for other devices:
Once we have distributions defined for all of the devices in our SIF, we are nearly ready to begin the uncertainty analysis for the SIF.
Function PFDavg Uncertainty
To assess the SIF, we want to use the device distributions to develop a distribution for the probability of failure on demand (PFDavg) for the SIF (this may be a little confusing since it is essentially a probability of a probability). For this example, we will use Monte Carlo simulation based on Simplified Equations for the SIL calculation. This will be done in Excel use the Crystal Ball plug-in (although other free options are available)
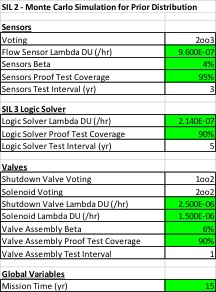
The first step is to enter all of the parameters and formulas into Excel to perform a regular SIL calculation with simplified equations. This is shown in the figure below. The highlighted fields are those where we have developed a distribution for the parameter instead of a point value (Note that in this example we also put distributions on Beta, Proof Test Coverage, and Mission Time).
Once the simplified equations are built and the distributions are assigned to each parameter using Crystal Ball, the Monte Carlo simulation is ready to run. Here is a short video demonstrating how to setup and run a Monte Carlo simulation using Crystal Ball.
The Monte Carlo simulation takes a random sample from each distribution (e.g. device failure rates, Beta, etc.) and calculates a single PFDavg value. This process is repeated thousands of time to build a distribution for PFDavg. The result of the simulation is shown below:
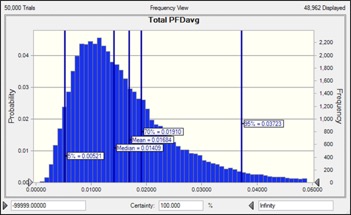
The resulting data can also be fit to a distribution (in this case a Beta distribution), and we can make inferences about PFDavg. For example, for the results above the 70% upper confidence limit of the data is PFDavg = 0.019, indicating that we are probably not meeting SIL2 and should have modified the SIF design or increased testing to meet SIL 2.
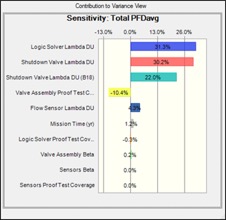
Another interesting product of the simulation is the sensitivity analysis produced by the software. In this example, the sensitivity analysis reveals the surprising result that the logic solver uncertainty is the largest contributor to SIF uncertainty! We didn’t cover that here, but it is a result of the large variance in logic solver industry data and the fact that we don’t have any redundancy to help mitigate the uncertainty.
Further Reading
For more discussion of this topic, including alternative approaches, check out the articles below.
- Preventing Preventable Failures (M. Generowicz) – A recent paper that touches on the topic of uncertainty, including confidence intervals and data from multiple sources.
- Evaluation of Uncertainty in SIL Calculations (Freeman, Summers) – An application of uncertainty analysis using Monte Carlo simulation and Variance Contribution Analysis (aka the method of moments). There is also a video available of the presentation.
- General Method Uncertainty Evaluation of SIL Calculations – Part 2 (Freeman) – A follow-up paper to the one above.
- Uncertainty Analysis for Target SIL Determination in the Offshore Industry (Kim et al) – Similar approaches are used to quantify uncertainty in LOPA used for SIL determination
Wrap Up
This is a topic I feel passionate about since I think we must first acknowledge the uncertainty in our work before we can improve on it. As you have likely seen, relying on cherry-picked point estimates of failure rates leads to a “race to the bottom” to see which vendor can make the most ridiculous claims about their product (or pay a 3rd party to do so). For an SIS discipline based on probability, SIS engineers have been surprisingly slow to embrace uncertainty!
I hope you found this quick tutorial useful. Please post any questions or comments, and feel free to contact me with questions. Don’t forget to follow us on LinkedIn. In case you missed them, here are some other related posts:
- IEC 61511 is Wrong About Systematic Failures
- A Hierarchical Bayesian Approach to IEC 61511 Prior Use
- Where to Find Failure Data